by Jalene Ippolito on October 21, 2021
When we talk with growing small and mid-size companies, without fail, one of the top challenges they face is a lack of visibility into their data. They have questions about their business performance that they can’t answer – at least not without a ton of time and manual effort.
What these companies want is a quick, easy way to get clear answers to their questions. They’re looking for a nice dashboard that neatly displays the data they care about most. Sounds simple enough, right?
Sort of.
If we take a step back, there are two foundational pieces you need to have in place before you can create that dashboard.
- You need reliable data that you can access easily. For many SMEs (small to mid-size enterprises), this is the big stumbling block. They have data scattered across multiple systems – often storing the same information in more than one place. So, the first step is consolidating that data into one system.
We help growing companies do this with ERP (Enterprise Resource Planning) software – it gives you a clear picture of your performance and provides a framework to adjust processes based on the insight you gain from your dashboard. - The second piece is defining your KPIs (key performance indicators). In a nutshell, KPIs help you focus your strategies and ensure you’re measuring the right metrics in your dashboard. That’s what we’ll discuss here – how to choose the right KPIs and get a clear picture of your performance.
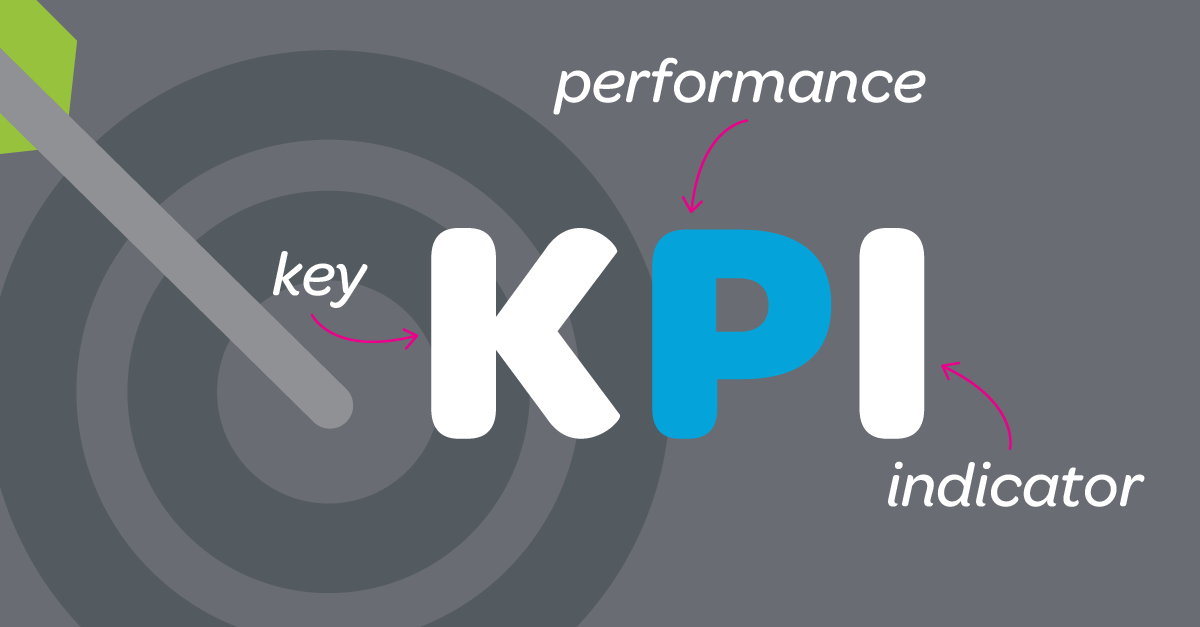
What is a key performance indicator?
A key performance indicator is a measurable value that demonstrates how effectively you’re achieving a specific business objective. At a high level, KPIs might focus on overall business performance. But they can also be used at lower levels of the organization, focusing on specific processes or department performance.
Ultimately, a KPI is a form of communication – it should be clear, relevant and inspire action.
How is a KPI different from a metric?
Where KPIs are tied to strategic objectives, metrics are the quantifiable measures that track the status of certain business processes. For example, if your objective is to increase sales revenue, you might use the number of new leads or opportunities as a metric to track your progress.
Looking for guidance on metrics? We've got you covered.
How do KPIs benefit your business?
Key performance indicators do more than just measure your performance. They help you decide what the strategy is in the first place.
That doesn’t just impact your senior management team – when communicated effectively, KPIs show everyone in the company what’s important and gets your team moving in the same direction. The quantifiable measure gives a clear indication of what’s working and where you need to adjust, rather than just taking an educated guess. Outside of seeing improvement in your numbers, this can give a big boost to employee engagement as people feel more connected to the company’s goals and can see how their efforts contribute.
How do you select the right KPIs?
1. Start from your business objectives
KPIs aren’t just a number. The objective needs to be tied to a strategic business outcome. What are you trying to achieve?
Start at the top and work your way down, asking that same question. What you’ll end up with is a cumulative effect – the organizational goal drives the goals for each department, which drives the goals for each individual. Here’s a simple example.
- Business goal: Increase revenue by 10% this year.
- Sales team goal: Close $2,000,000 in new business this year.
- Salesperson goal: Close one deal worth $250,000 each quarter.
As you can see, the KPIs change at different levels of the organization based on their objectives. Employees that are executing the work will be more focused on short-term objectives, whereas executives will be looking long-term. The important thing here is that each KPI is tied to a single strategic business objective and gives you a target to measure against.
2. Make your KPIs SMART
Following the standard principle of SMART goals will help you define your KPIs so everyone on your team understands what you’re working toward.
- Specific: What is the desired outcome (in terms of dollars, percentage improvement, etc.)?
- Measurable: How will you measure progress? How will you know you’ve achieved your outcome?
- Attainable: What’s a realistic target that we could achieve based on our current performance? What’s the stretch goal?
- Relevant: Why does this outcome matter?
- Time-bound: When do we want to achieve this goal? How often will we review progress?
3. Focus on action
A final test before you share your KPIs is to check that you can control the outcome. For example, let’s say your service department has a goal of reducing the number of service requests for a given product. But they discover that most requests are tied to a production issue, so they can’t control that outcome. With that knowledge, this KPI wouldn’t make sense for the service department to focus on.
Once you have your KPIs set, communicate them to your team, including what you’re measuring and why. This will help them understand where you’re headed and how they can help. Particularly for long-term goals, it’s helpful to set short-term KPI targets – these milestones along the way will guide your efforts and keep your team motivated as they see the progress.
4. Review your KPIs regularly
Your KPIs are only useful if people are relying on them to guide their decisions! Set a regular time that you review progress, whether it’s weekly, monthly or quarterly. If you find that people aren’t monitoring KPIs, adjust your reporting and processes to make it easier to consume the information.
Keep in mind that KPIs aren’t set in stone – they’ll change along with your business. Review them periodically to see if they still make sense with where the business is at today and adjust as necessary.
5. Limit the number of KPIs you choose
It can be tough to narrow your focus, but you’ll be better off in the long run focusing on a few things. The name says it all – key performance indicators are the ones that are critical to success.
And the same goes for metrics. Once you have clarity on the KPI, don’t go overboard with the metrics you want to measure. There’s no magic number – what’s right for your business will depend on your goals, capacity and more. But if you think you have too many metrics, use the IPA test:
- Importance: Does the metric matter to your goals?
- Potential improvement: Can you implement tactics that will change the metric?
- Authority: Do you have the power to influence change?
Final thoughts…
If you’re interested in KPIs, that’s a good indicator that you’re looking to improve business performance. One important step to doing that? Implement ERP software.
By nature, ERP simplifies your business processes by eliminating disparate systems and connecting your teams in one place. It’s easier to share information, you have greater visibility across the business, and you have a platform that enables you to adjust your processes based on the insights you gain from your KPIs.
The potential for improvement is huge. And we can help you get there. Take our ERP Need Assessment to find out whether ERP is the right fit for your business today. By answering 20 questions, you’ll get a personalized report with next steps based on your current tools, reporting challenges, and growth plans.