Blog
Share this
12 Financial Metrics Every SME Should Measure

by Jalene Ippolito on July 08, 2021
Getting an accurate picture of your financial health is critical for small and mid-size business leaders. Financial metrics and KPIs create that picture for you. Monitoring financial metrics helps you understand your current state and make the best decisions to improve your financial health moving forward.
While there are many metrics you could track in your business, it’s not realistic to track them all. The right metrics will depend on your industry and the goals you’re working to achieve. But we’ve come up with a short list of financial metrics that should be top of the list for all growing businesses.
1. Operating cash flow
Operating cash flow is one of the most critical metrics to track and analyze. In fact, it’s the top priority KPI for 81% of finance teams. Measuring operating cash flow helps you understand how much cash is moving in and out of the business. It gives you a sense of how much cash you can spend in the immediate future and act as a red flag if spending cuts are required.
Operating cash flow = net income + non-cash expenses – increase in working capital
2. Revenue
The revenue metric shows how much money you’re bringing in from sales of products or services, before deducting expenses.
You can calculate your revenue figure a couple different ways. If you use accrual accounting, customer purchases made on credit are included in revenue, even if you haven’t received payment. In cash accounting, you only include money in your bank account towards your revenue figure.
Revenue = sales price x units sold
3. Expenses
Expenses include all costs incurred to operate and earn revenue. This includes operating expenses (wages, equipment, supplies, etc.) and non-operating expenses (like interest and lending fees).
Here again, if you use accrual accounting, you factor in expenses as they’re incurred, even if you haven’t paid for them yet. In cash accounting, you only include expenses once they’re paid.
Expenses = cost of goods sold + salaries + sales commissions + marketing costs + real estate expenses + utilities
4. Net income
Also known as net profit (or the bottom line), net income measures the money left over after subtracting all expenses and taxes from revenue. If you aren’t bringing in enough revenue to cover expenses, you run the risk of falling behind on payments and racking up debt.
Net profit = revenue – total expenses
5. Budget vs. actual
By comparing actual spend (or sales) in a certain area against budgeted amounts, leaders can identify where they’re overspending. On the positive side, it can also reveal where you’re performing better than expected. Think of this metric as a jumping off point that tells you where to dig deeper. If your sales team underperformed, you’ll want to know why. Or if your budget was off, re-evaluate your budgeting process. How did you come up with the budget number? Was it based on data or a best guess?
Budget variance percentage = actual / forecast – 1 x 100
6. Gross profit margin ratio
Your gross profit margin ratio shows your revenue after deducting cost of goods sold. This reveals the gross profit for every dollar of revenue earned. For example, if you have a gross profit margin ratio of 55%, that means you’ve received 55 cents of profit for each dollar of revenue.
Typically, you want a gross profit margin no lower than 10%, but this differs by industry. In 2020, the average for wholesale distributors was 24.4%, whereas engineering firms came in at 31.5%. Understand what the benchmark is for your industry and, most importantly, measure your performance over time.
Gross profit margin ratio = (revenue – COGS) / revenue x 100
7. Quick ratio
Also known as the acid test ratio, the quick ratio measures whether you can fulfill your short-term financial obligations. A ratio of 1.0 means you have just enough assets to cover your liabilities, so a higher number is preferable to give you more flexibility.
Quick ratio = (cash + marketable securities + accounts receivable) / current liabilities
8. Average customer acquisition cost
Understanding how much you spend to add new customers is an important measure of your marketing success. The calculation includes expenses for marketing, technology, payroll and more. Your average customer acquisition cost is proportional to the price of your product or service, so it will be higher in some industries. While the average retailer spends $10 to acquire a customer, a technology provider could spend upwards of $395.
Cost of customer acquisition = (cost of sales + cost of marketing) / new customers acquired
To truly get the value from this metric, experts recommend looking at it relative to the lifetime value of that customer. If you spend $500 to acquire a customer but they bring in $20,000 in recurring annual revenue, it’s worth the spend. On the flip side, if your acquisition cost is too high, this is an indicator that you need to improve your marketing performance to get a better return. At the same time, you can focus on ways to retain and upsell your existing customers to increase their lifetime value.
9. Churn rate
Measuring churn rate helps you understand how ‘sticky’ your product or service is. A high churn rate indicates that you’re losing customers more frequently. Given that it’s more expensive to land new customers than it is to keep existing ones, you’ll want to understand why your churn rate is high and take steps to correct it. You may need to change something about your offering or find better ways to nurture your customers.
Churn rate = lost customers / starting number of customers x 100
10. Accounts receivable turnover ratio
The accounts receivable turnover ratio measures how well you collect cash from credit sales. A higher ratio is better, as it means your customers are paying faster. When accounts receivable is consistently behind (a low ratio), it hurts cash flow and lowers your chance of collecting as time passes.
Accounts receivable turnover ratio = net credit sales / average accounts receivable
We recommend using this metric in combination with an accounts receivable aging report to identify which customers are overdue and by how much. This report is typically organized by due date (immediately, 1 to 30 days late, 31 to 60 days late), so you can prioritize follow-up.
It’s also useful to analyze your data to understand how the timing of payment impacts your business. For example, at what point does it become more difficult to collect payment? When the invoice is 40 days past due? 45 days? This will help your accounting team direct their collection efforts.
11. Current accounts payable
Current accounts payable tells you the current value of your payables (how much you owe to vendors). It’s a key metric that works alongside current accounts receivable to help you understand your cash flow.
Here again, it’s useful to dig deeper with an accounts payable aging report to see your upcoming bills and when they’re due. This will help you prioritize payments and ensure you can meet your upcoming obligations.
12. Cash runway/burn rate
Cash runway tells you how long you have before you run out of cash. This is based on the money you currently have available and how you’re spending per month (burn rate). Especially in times of crisis like we saw throughout 2020, this is a top metric to help you manage spending risk proactively.
Cash runway = cash balance / monthly burn rate
Get the financial reporting power you need with ERP software
If you’re already measuring some or all these financial metrics, you’re off to a great start. But, in our experience as an ERP partner, we’ve noticed that many small and mid-size businesses can’t track these metrics today (at least not easily). They simply don’t have easy access to their data. If they can report these numbers, they’re often spending a ton of time heads down in a spreadsheet to get there.
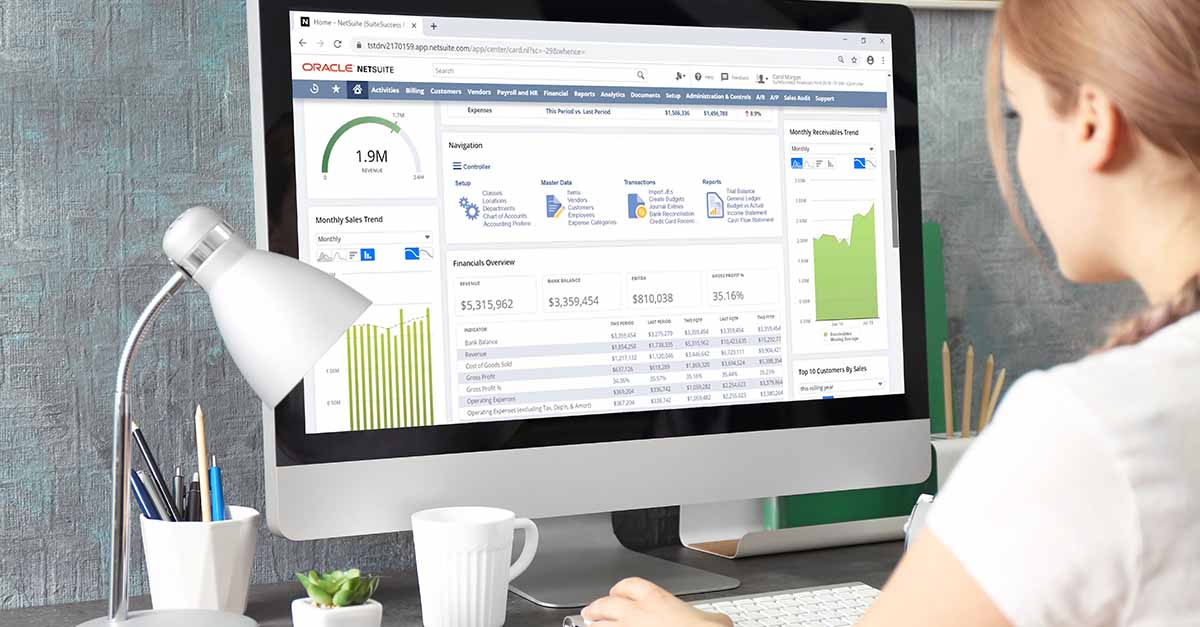
For growing companies, visibility and easy reporting is critical. Imagine if you had a ready-to-go dashboard where you could check these metrics anytime – no time delay and no manual calculations required. It’s possible today. Finance is at the core of every ERP solution, giving you easy access to reliable data. So, you can identify the issues holding you back and overcome them faster.
If you're wondering whether ERP could give your team the visibility and reporting power it needs, our ERP Need Assessment can help. In just 5 minutes, you'll get a personalized report on how much your business needs ERP—plus recommendations on what to do next.
Share this
Stay in the Know!
Join other SMEs who receive our monthly ERP insights, tips and best practices.
You may also like

ERP Funding for Canadian Businesses

Should You Work with a NetSuite Implementation Partner or Go Direct?


