by Jalene Ippolito on October 14, 2021
Creating dashboards that truly provide value is a combination of science and art. Clearly, data is at the heart of it, answering key questions about your business. But transforming that data into a set of visuals that you can quickly interpret is where the art comes in.
Luckily, with the dashboard tools available today, you don’t need a ton of technical experience to create dashboards. But to ensure you get the most useful result, it’s wise to focus on the fundamentals first. That's the goal of this post – to help you understand the best practices of dashboard design so you have actionable insight into your data, not just a summary of past performance.
1. Identify your reporting requirements
Whether you’re using a stand-alone dashboard application or the dashboard tool within your ERP system, it’s easy to drag-and-drop widgets from a library and voila – you have a dashboard!
As tempting as it might be to jump straight to that point…take a step back and make sure you understand the purpose of your dashboard. Here are a few questions to help you clarify your requirements.
- Why do you need the dashboard?
- What’s the question (or questions) you’re trying to answer?
- What data do you need to decide your next steps?
- Which metrics will help tell the story?
- What action can you take based on these insights?
2. Know your audience
Understanding who will use the dashboard – and how they’ll use it – is an extension of identifying your reporting requirements. This will help you determine what type of dashboard you create and how detailed the data will be. Ask yourself:
- Who will use the dashboard?
- How will they use the information?
- What are their technical skills?
- How much time can they spend analyzing data?
Remember that defining a specific set of viewers will help you narrow the information to what they care about most and present it in the most effective way. For example, your accounting team likely needs a little bit more detail with the ability to easily drill-down for further analysis. But field service teams will want quick highlights that will direct their activities, without having to dig deeper.
3. Select the right type of dashboard
With a clear picture of your audience and the purpose of the dashboard, you can select the right type. This will help you select the right KPIs to answer the viewers’ questions.
- Strategic dashboards are like your high-level overview. They’re typically aimed at C-suite and senior leadership to demonstrate the health of the business and help identify areas of opportunity.
- Analytical dashboards go much deeper and tend to be highly focused, providing detailed analyses of data trends (what, why, how). They measure data variables over time to determine what’s working and what’s not.
- Operational dashboards focus on KPIs that monitor real-time operations of the business or a specific department. You’ll typically see measurements comparing current state to targets or past performance.
- Tactical dashboards are often used for middle management, offering insight into weekly trends and metrics that drive internal processes.
4. Choose the right data visualizations
Our brains digest visual information more efficiently than textual insights – that’s exactly why dashboards are so effective. The key is selecting the right chart or graph to help people interpret the data. Here’s the rundown on the different visualizations you can choose from and when to use them.
A simple rule of thumb – ask yourself ‘How well does the visualization relay the intended information?’.

Analyze trends
If you want to illustrate a trend over a set time period, use distribution visualizations.
- Line charts are a clear way to display trends over time. Be careful not to add too many lines, as that will make the chart hard to read.
- Column graphs are commonly used to show chronological data, like growth over a period, or for comparing data across categories.
- Stacked area charts simultaneously display trends over time and the part-to-whole relationship. The total vertical of the stack shows the whole, with the height of each separate data set showing the parts.
Show the composition of data
Composition visualizations help you show how individual segments of data make up the whole.
- Pie charts are useful to demonstrate how individual parts make up the whole. Because they’re less precise and our eye can’t easily compare the size of the slices, pie charts are best used when approximation is okay.
- Waterfall charts show the composition of data over a set time period, with positive and negative values illustrating the overall cumulative effect. These are static charts, so they’re not a great choice if you need dynamic data.
- Stacked charts illustrate part-to-whole relationships over different periods.
- Map-based graphs are great for visualizing geographical data using color to tell the story.
Compare two or more sets of data
While most visualizations will allow you to compare multiple data sets, these options will showcase the comparison in a more impactful way.
- Bar graphs can effectively show comparative rankings.
- Gauge charts use needles and colors to show a single value relative to a target. Also known as dial charts or speedometer charts, they’re often used in strategic dashboards to help business leaders track progress against KPIs.
- Bubble plots are a great way to show the relationship between data sets, like different product categories or revenue streams.
- Scatter plots can help you illustrate the correlation in a large data set. You won’t often see them in a dashboard because they can be quite complex and require a bit of thinking to interpret correctly.
Highlight a number
Number charts give you an immediate view of a particular metric. At a quick glance, you can see any total, like sales, EBITDA, gross profit %, value of open purchase orders and more. Be sure to label the time period clearly so viewers understand what the data is telling them. You can also add a trend indicator that compares the number to the previous period.
Display your data in a table
Technically, tables aren’t a visual format. But there are cases where you just need to display the information in a table. If your audience needs to know the underlying data and easily dig deeper, tables can be a great option. And remember that tables can be visually appealing by using fonts, number formats and icons to highlight the data effectively.
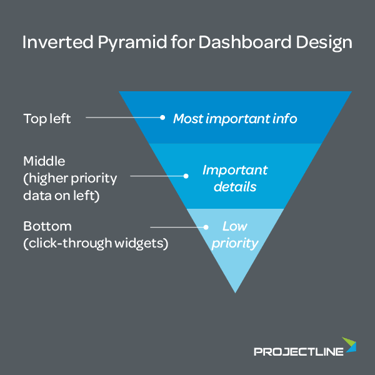
5. Choose your layout carefully
 At this point, we’ve talked a lot about the data. Now, we’re getting into the art of dashboard design. Even if your visuals are spot on, a poor layout can make it difficult for users to grasp the point. You want a visually organized dashboard that helps users easily find the information they need.
Keep in mind how we read – top to bottom, left to right. Additionally, eye tracking studies show that web users spend more time viewing the left half of the page versus the right. So, to help viewers absorb the information, you’ll want to put the most important information first. Typically, that means you’ll start with the big picture, then proceed to more detailed information as you move down.
6. Focus on simplicity
To make the data the star in your dashboard, you want to eliminate distractions. Anything that pulls attention away from the story you’re trying to tell needs to go. Remember that effective communication is the number one priority.
Here are a few quick tips on simplicity:
- Follow the five-second rule – viewers should be able to absorb the information in about five seconds.
- Group related information together and use a visual border or simple shading to designate unique groups.
- Use consistent alignment to keep the eye from wandering.
- Take advantage of white space. This refers to the space that’s void of all images, colors, text and data. It improves balance, enhances readability and draws focus to what matters – the data.
- Use contrast to highlight important information. This is often done with color or simple design variations.
- Round your numbers. Remember this is the quick view – you want to make the data easy to consume. When you’re talking about $850K, 10 cents won’t change the understanding of the data.
- Keep the data focused – too many metrics complicates the analysis and leads to dashboard fatigue.
7. Provide context
Help your audience understand the data by providing context that explains the data. Even something as simple as showcasing a KPI number without indicating the timeframe can lead to misunderstandings and flawed decision making.
- Add a title to each chart telling the viewer what it represents.
- Label the axes, columns, rows, keys, etc.
- Indicate comparisons between other relevant periods (previous month, quarter, etc.).
- Evenly distribute reference points on a scale and set the scale to start at zero.
- Add tooltips to provide additional information when you hover over a visualization.
8. Use color thoughtfully
Color can be a useful tool to help you tell the story – when used effectively. The most important thing is to pick a color scheme with a handful of colors and use it consistently. You can use your brand colors but be sure to consider commonly accepted meanings of color. For example, if one of your brand colors is red, that might not be the best choice as red is typically associated with ‘bad’ or ‘stop’. Saturated colors draw attention, so use them for that purpose, alongside other colors that are toned down.
Your goal is to achieve maximum contrast, while avoiding color clashes and over-colorization.
9. Use interactive elements for deeper analysis
Remember that your dashboard should help users determine their next steps. In many cases, this means digging deeper into the data to troubleshoot issues, understand anomalies or evaluate opportunities. Make it easy for users to do this with interactive elements like drill-down capability, filtering options or time intervals.
If you’re using ERP software, the drill-down capabilities offer a huge advantage. With your dashboard and all supporting data in the same system, you can easily click through to transactions and get a deeper understanding of the data without switching to other systems.
10. Involve your end users
Thinking back to best practice #2 (know your audience), get input from the people who will be using the dashboard – early and often. This will help you understand what makes sense to the user and they can provide feedback to continue enhancing the dashboard over time.
Finally, designate a dashboard champion in each department to own the process and train other users on how to use them. Even with a well-designed dashboard, it’s best not to assume that people will intuitively know how to read it and use the interactive features.
Dashboards + ERP software = a winning combo
If you’re not using ERP software yet, it’s the path forward to getting fast, reliable insight into your business. And that’s the goal of a dashboard, isn’t it?
The thing to remember is that the information you get from your dashboard is only as good as the data in the background. For many of the small to mid-size businesses we work with, dashboards were something they dreamed of, but couldn’t implement because their data was scattered across multiple systems and spreadsheets.
ERP solves that challenge by consolidating your data in one system and giving you easy-to-use dashboard tools so you can gain valuable insight into your business.